Apart of BIOL342 was analysing and interpreting the data that was synthesised from the protein aggregation experiment. This included having a laboratory notebook that contained all the observations about the experiment and writing a scientific report.
Before BIOL342 I had experience in analysing and interpreting experimental data from past UOW lab assessments. The research data from the samples of the protein aggregation experiment were synthesised by reading the light scatter produced by the samples. This data was used to create graphs for the different parts of the experiment to analyse and interpret the results. From these graphs I was able to see the patterns and for example determine that reduction stress can increase protein aggregation and light scattering (Figure 7). According to UOW Assoc. Prof. Martina Sanderson-Smith, I did well in synthesising, graphing, analysing and interpreting research data in my LabArchives eNotebook (Figure 8). However, for the scientific report of the experiment I didn’t do very well in the statistical analysis on the results (Figure 9).
In the future, if I do a research project again, I will double check my analyse and interpretation of the data and ask for a second opinion.

Figure 7: Extract of graph results and interpretation created for Project 1: Protein Aggregation. Results were written for the three parts of the experiment and displayed in an eNotebook on LabArchives.
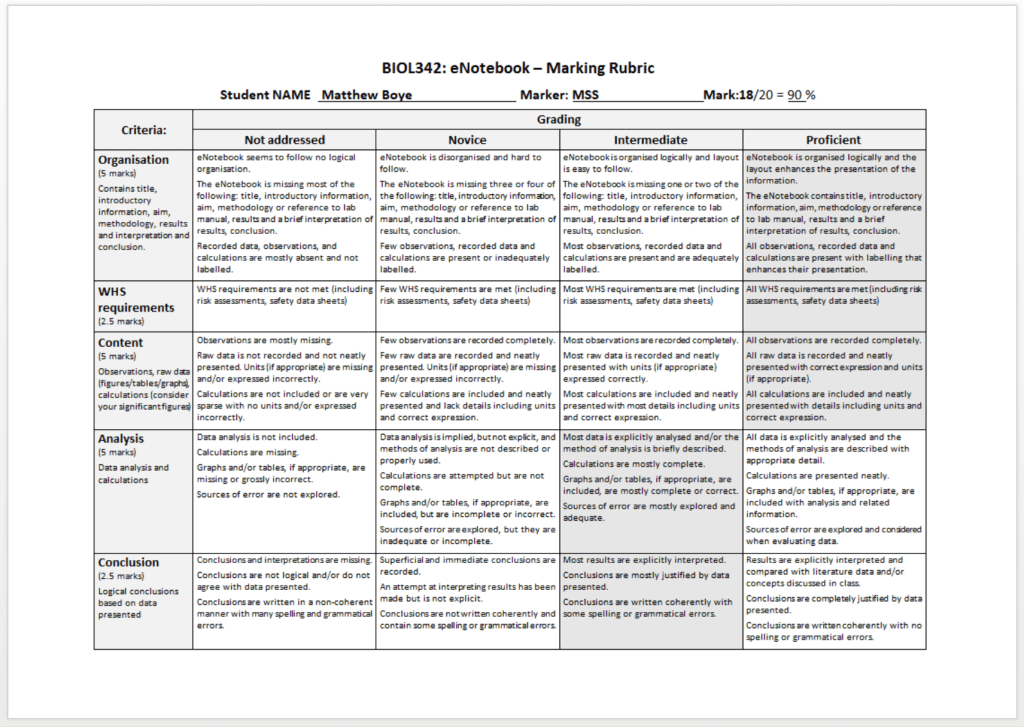
Figure 8: Marks and feedback for Project 1: Protein Aggregation eNotebook.
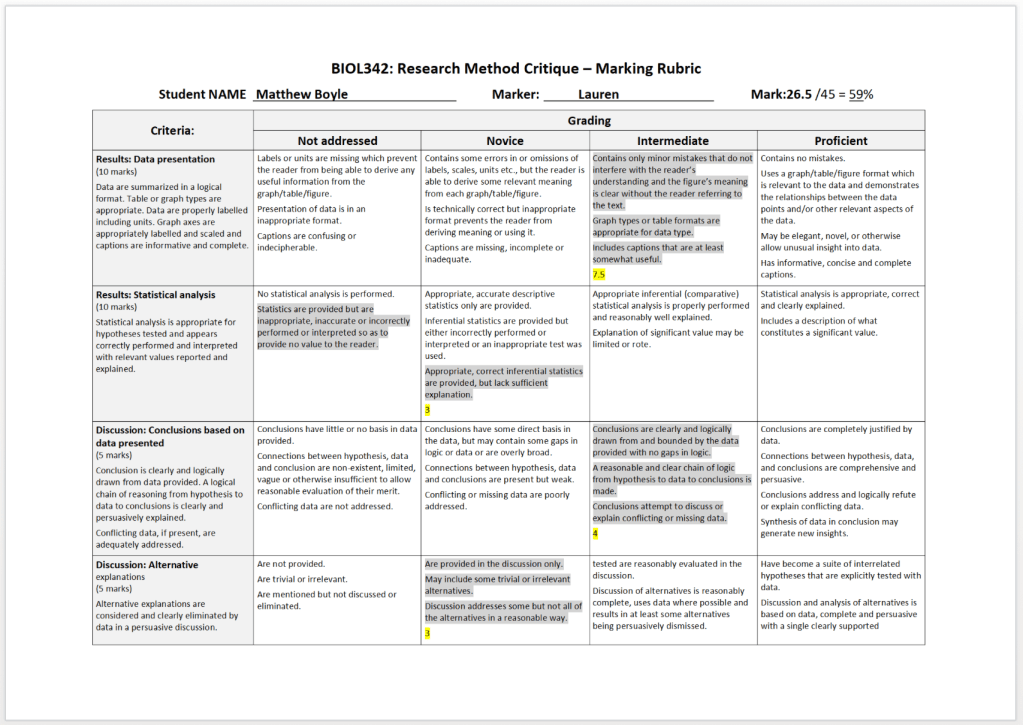

Figure 9: Marks and feedback for Project 1: Protein Aggregation research report.
